Nobscot home
Home Online Interview Products Demo & Screen Shots Nobscot Client List Library Nobscot Management Contact Us User Login
Retention Management And Metrics
 

US Monthly Employee Total Separation Rates by Industry and by Geographic Region

The following charts show the monthly employee total separation rates for U.S. employees by industry and by geographic region1. All numbers are percentages. Employee Total Separation represents employee turnover resulting from all voluntary and involuntary employment terminations. Click here to see the same charts for Voluntary Employee Turnover only. Click here for historical separation charts.

Data is supplied by the U.S. Department of Labor.


U.S. Totals - Employee Total Separation

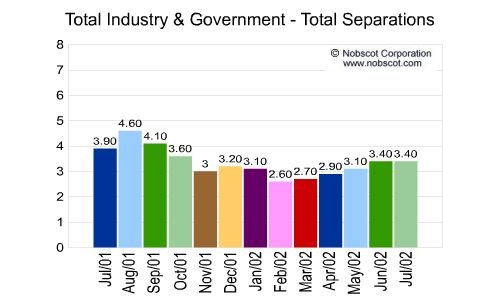
U.S. Totals - Employee Total Separation Monthly Employee Turnover Rates - Total Separations
Annual Turnover: 40.0%
(Aug/01 - Jul/02)
 

Private Industry

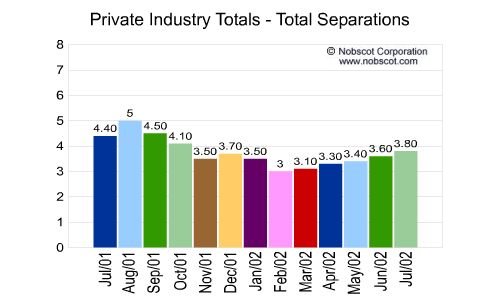
Private Industry Monthly Employee Turnover Rates - Total Separations
Annual Turnover: 46.0%
(Aug/01 - Jul/02)
 
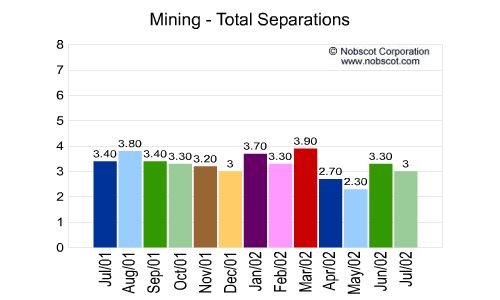
Mining Monthly Employee Turnover Rates - Total Separations
Annual Turnover: 38.0%
(Aug/01 - Jul/02)
 
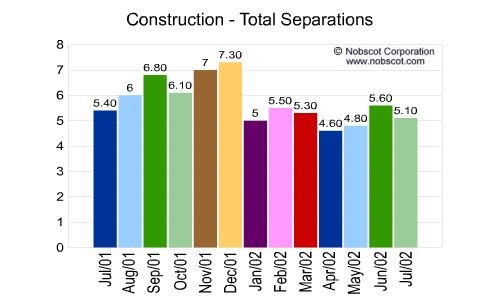
Construction Monthly Employee Turnover Rates - Total Separations
Annual Turnover: 70.0%
(Aug/01 - Jul/02)
 
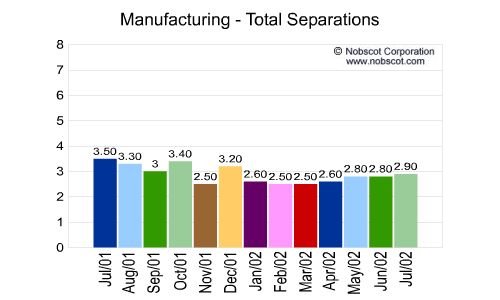
Manufacturing Monthly Employee Turnover Rates - Total Separations
Annual Turnover: 36.0%
(Aug/01 - Jul/02)
 
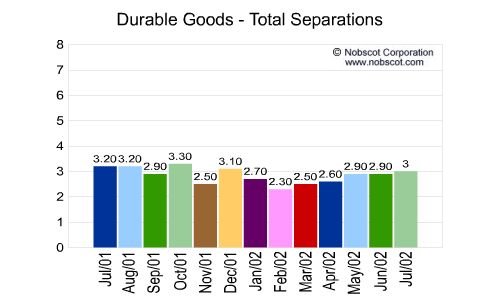
Durable Goods Monthly Employee Turnover Rates - Total Separations
Annual Turnover: 35.0%
(Aug/01 - Jul/02)
 
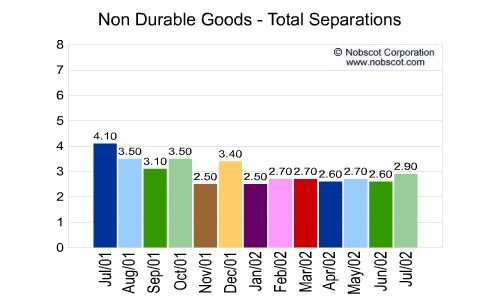
Non Durable Goods Monthly Employee Turnover Rates - Total Separations
Annual Turnover: 38.0%
(Aug/01 - Jul/02)
 
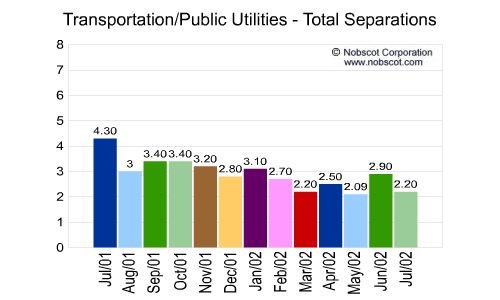
Transportation/Public Utilities Monthly Employee Turnover Rates - Total Separations
Annual Turnover: 33.0%
(Aug/01 - Jul/02)
 
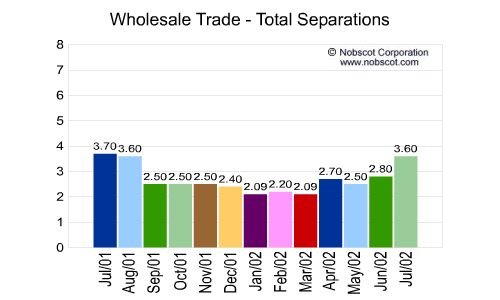
Wholesale Trade Monthly Employee Turnover Rates - Total Separations
Annual Turnover: 34.0%
(Aug/01 - Jul/02)
 
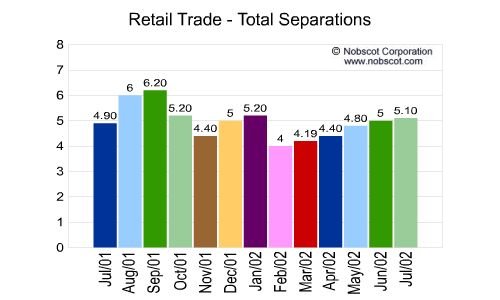
Retail Trade Monthly Employee Turnover Rates - Total Separations
Annual Turnover: 58.0%
(Aug/01 - Jul/02)
 
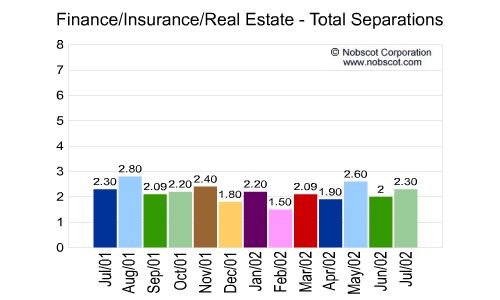
Finance/Insurance/Real Estate Monthly Employee Turnover Rates - Total Separations
Annual Turnover: 26.0%
(Aug/01 - Jul/02)
 
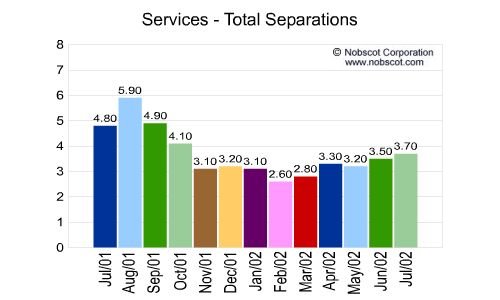
Services Monthly Employee Turnover Rates - Total Separations
Annual Turnover: 44.0%
(Aug/01 - Jul/02)
 

Government

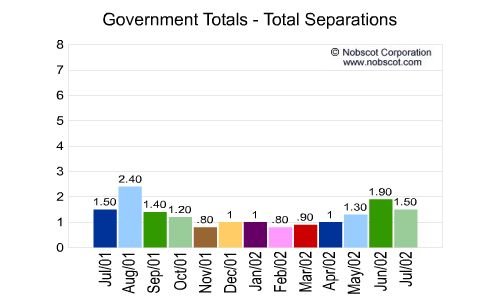
Government Monthly Employee Turnover Rates - Total Separations
Annual Turnover: 15.0%
(Aug/01 - Jul/02)
 
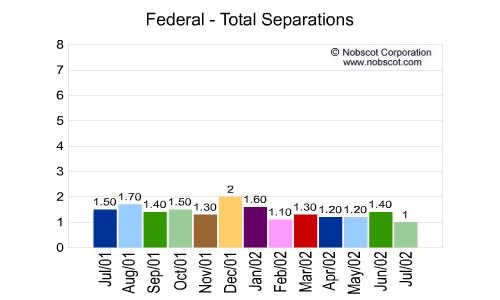
Federal Monthly Employee Turnover Rates - Total Separations
Annual Turnover: 16.0%
(Aug/01 - Jul/02)
 
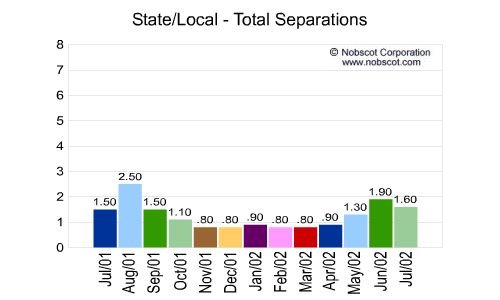
State/Local Monthly Employee Turnover Rates - Total Separations
Annual Turnover: 17.0%
(Aug/01 - Jul/02)
 

U.S. Geographical Region

U.S. Geographical Region Monthly Employee Turnover Rates - Total Separations
Annual Turnover: 37.0%
(Aug/01 - Jul/02)
 
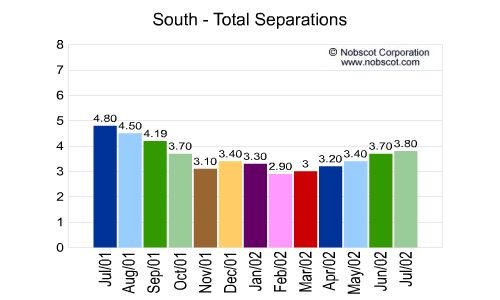
South Monthly Employee Turnover Rates - Total Separations
Annual Turnover: 42.0%
(Aug/01 - Jul/02)
 
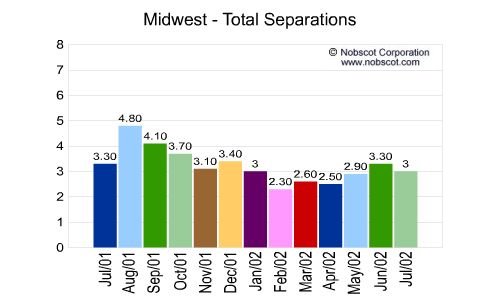
Midwest Monthly Employee Turnover Rates - Total Separations
Annual Turnover: 39.0%
(Aug/01 - Jul/02)
 
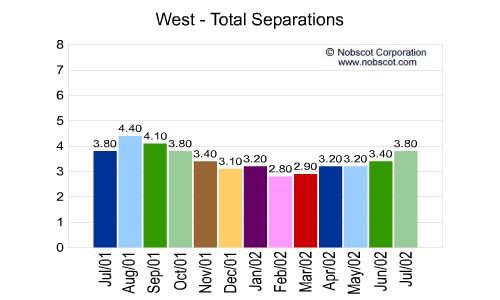
West Monthly Employee Turnover Rates - Total Separations
Annual Turnover: 40.0%
(Aug/01 - Jul/02)


 Geographic Regions
RegionStates
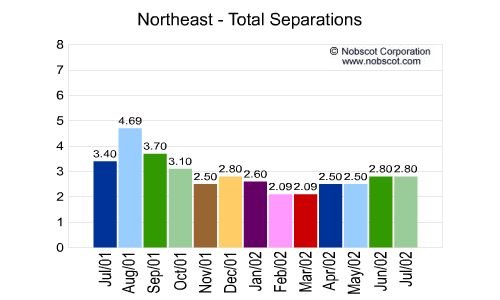
NortheastConnecticut, Maine, Massachusetts, New Hampshire, New Jersey, New York, Pennsylvania, Rhode Island, and Vermont
SouthAlabama, Arkansas, Delaware, District of Columbia, Florida, Georgia, Kentucky, Louisiana, Maryland, Mississippi, North Carolina, Oklahoma, South Carolina, Tennessee, Texas, Virginia, and West Virginia
MidwestIllinois, Indiana, Iowa, Kansas, Michigan, Minnesota, Missouri, Nebraska, North Dakota, Ohio, South Dakota, and Wisconsin
WestAlaska, Arizona, California, Colorado, Hawaii, Idaho, Montana, Nevada, New Mexico, Oregon, Utah, Washington, and Wyoming


How Honest Is Your Feedback? RIF Manager FirstDays for New Hires
Who we are Customer Support Products Press Employee Mentoring Corporate Talent Networking
Customers Testimonials Home Site Map Employee Retention News Rebound Employees
Exit Interview Employee Satisfaction Survey What is an Exit Interview? Employee Turnover Rates

© Copyright 2000-2024 Nobscot Corporation. All Rights Reserved.
Privacy Policy -  Terms of Use
Change my password.