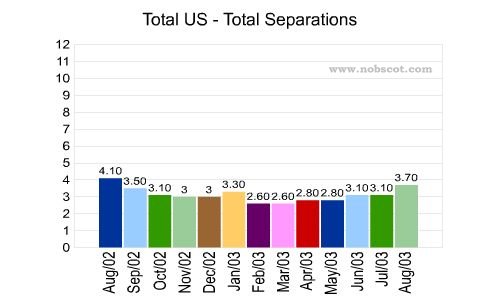
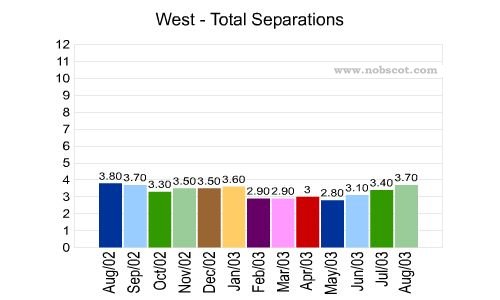
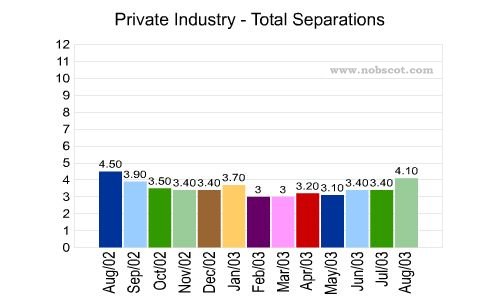
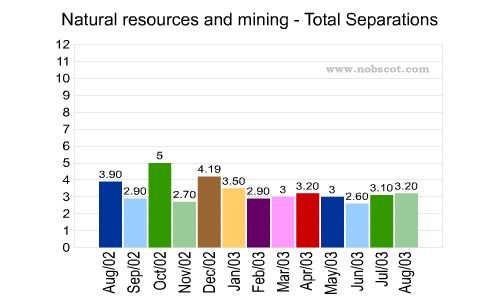
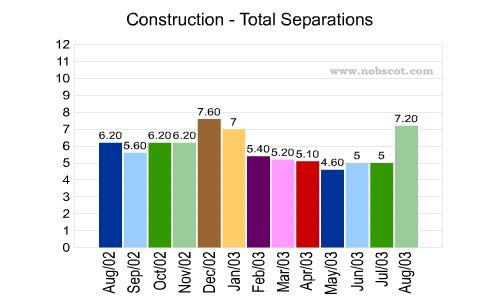
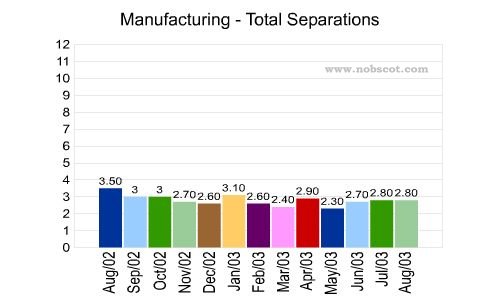
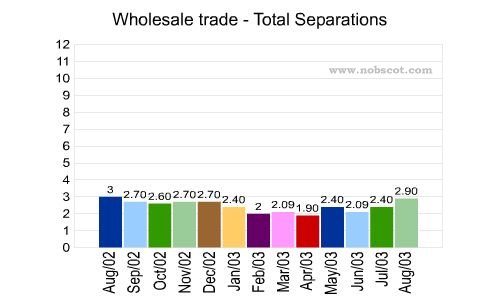
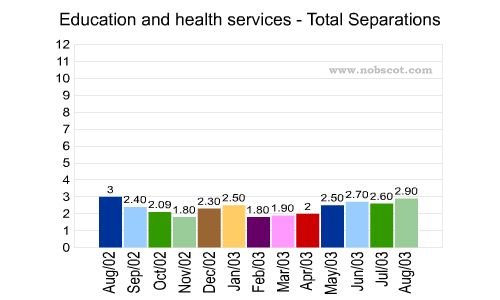
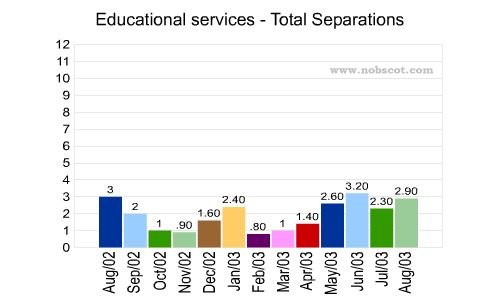
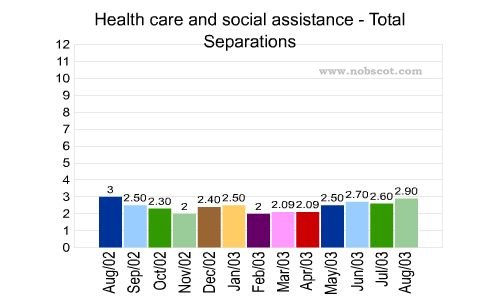
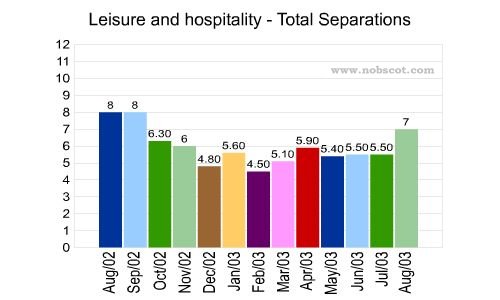
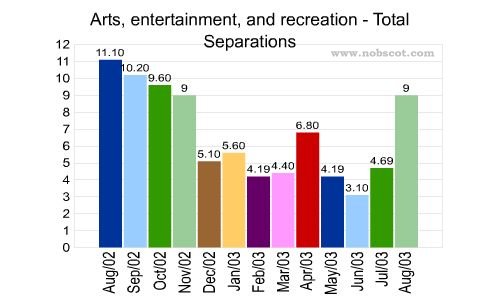
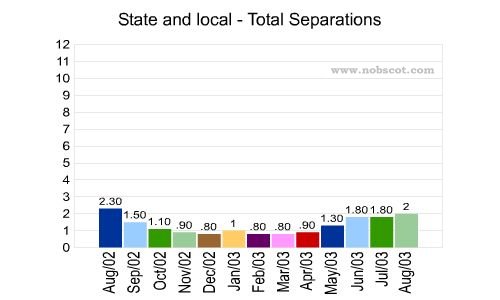
The following charts show the monthly employee total separation rates for U.S. employees
by industry and by geographic region
. All numbers are percentages.
Employee Total Separation represents employee turnover resulting from
employment terminations.
Data is supplied by the U.S. Department of Labor.
|
Total US |
 |
|
| |
|
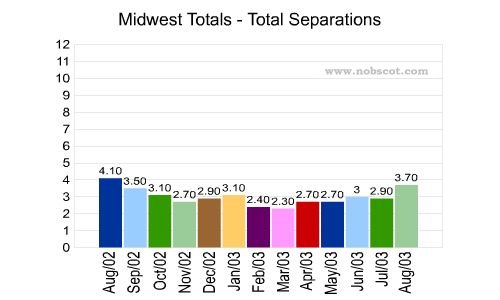
Midwest |
 |
|
| |
 |
|
| |
 |
|
| |
 |
|
| |
 |
|
| |
 |
|
| |
 |
|
| |
 |
|
| |
 |
|
| |
 |
|
| |
 |
|
| |
 |
|
| |
 |
|
| |
 |
|
| |
 |
|
| |
|
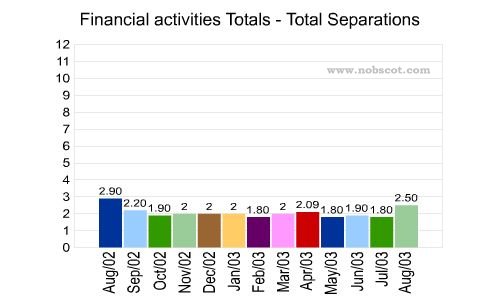
Financial activities |
 |
|
| |
 |
|
| |
 |
|
| |
 |
|
| |
 |
|
| |
 |
|
| |
 |
|
| |
 |
|
| |
 |
|
| |
 |
|
| |
 |
|
| |
|
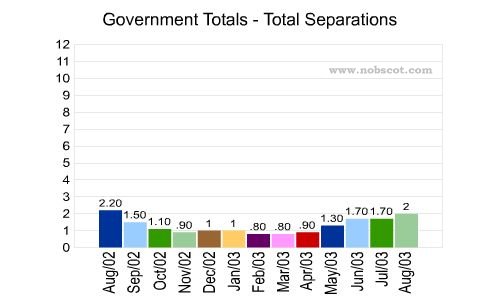
Government |
 |
|
| |
 |
|
| |
 |
|
| |
| Geographic Regions |
|---|
| Region | States |
|---|
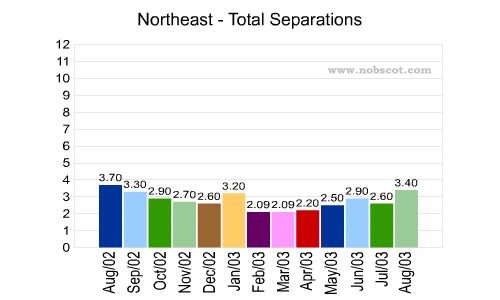
| Northeast | Connecticut,
Maine, Massachusetts, New Hampshire, New Jersey, New York, Pennsylvania, Rhode Island, and Vermont |
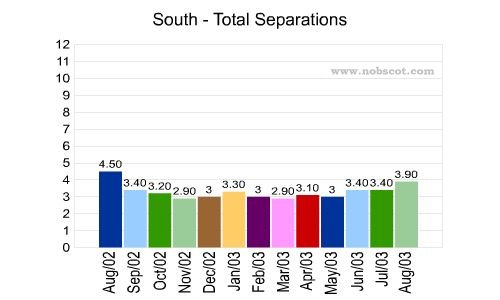
| South | Alabama,
Arkansas, Delaware, District of Columbia, Florida, Georgia, Kentucky, Louisiana, Maryland, Mississippi, North
Carolina, Oklahoma, South Carolina, Tennessee, Texas, Virginia, and West Virginia |
| Midwest | Illinois, Indiana, Iowa,
Kansas, Michigan, Minnesota, Missouri, Nebraska, North Dakota, Ohio, South Dakota, and Wisconsin |
| West | Alaska,
Arizona, California, Colorado, Hawaii, Idaho, Montana, Nevada, New Mexico, Oregon, Utah, Washington, and Wyoming |