US Annual Employment Turnover Rates by Industry and by Geographic Region
Through Aug/03
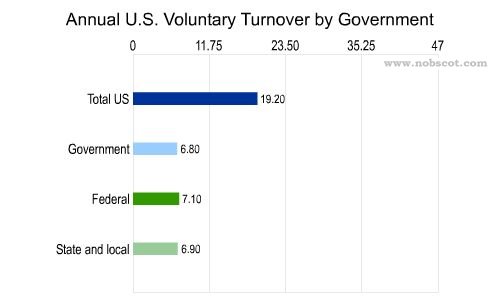
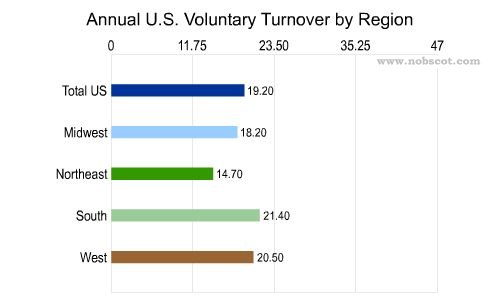
The following charts show the annual employee turnover rates for U.S. employees
by industry and by geographic region1. All numbers are percentages.
Employment Turnover represents turnover resulting from
employees voluntarily leaving their employment. Click here to see the same charts for Total Separations.
Click here for historical turnover charts.
Data is supplied by the U.S. Department of Labor.
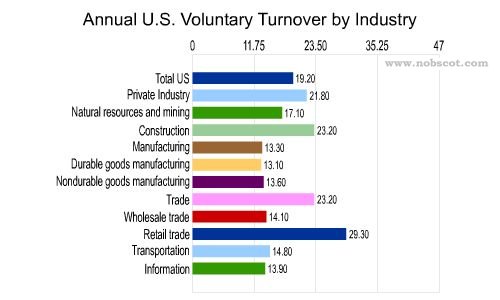
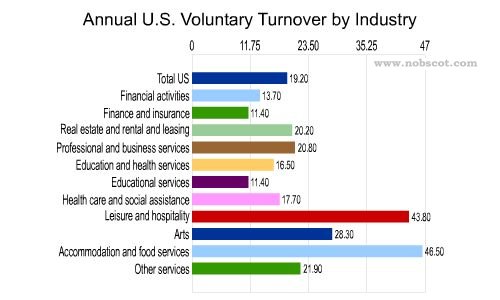
Employee Turnover Rates - Voluntary by Industry (Sep/02 - Aug/03)
Connecticut,
Maine, Massachusetts, New Hampshire, New Jersey, New York, Pennsylvania, Rhode Island, and Vermont
South
Alabama,
Arkansas, Delaware, District of Columbia, Florida, Georgia, Kentucky, Louisiana, Maryland, Mississippi, North
Carolina, Oklahoma, South Carolina, Tennessee, Texas, Virginia, and West Virginia
Midwest
Illinois, Indiana, Iowa,
Kansas, Michigan, Minnesota, Missouri, Nebraska, North Dakota, Ohio, South Dakota, and Wisconsin
West
Alaska,
Arizona, California, Colorado, Hawaii, Idaho, Montana, Nevada, New Mexico, Oregon, Utah, Washington, and Wyoming