Turnover Prediction Mapping
April 26, 2015 | By Beth N. Carvin
You don't have to have a crystal ball to predict future turnover.
 If you conduct both employee satisfaction surveys and exit interviews, you can
create a customized map that tells you exactly which areas within your organization
can expect future turnover and what the cause of that turnover will be.
If you conduct both employee satisfaction surveys and exit interviews, you can
create a customized map that tells you exactly which areas within your organization
can expect future turnover and what the cause of that turnover will be.
Coordinating Your Surveys and Exits
The first step is identifying what items cause turnover for your organization. Turnover is unique to each organization so items that may cause turnover in one company, may or may not cause turnover in your company. Before you can begin to identify your turnover stimulators, you need to coordinate your employee survey process with your exit interview process. You’ll need a consistent set of questions that will be asked in both surveys and exits. The questions should cover all areas including Environment, Management, the Company, Compensation, etc. The questions should be quantifiable by having employees rate the items on a numerical scale (Ex. 1-5). Be sure to keep your rating system consistent so that one side of the scale is always the favorable side and the other side is the unfavorable side. Have employees provide demographic information such as department, location and job classification. Once you have a sufficient number of completed surveys and exit interviews you can begin the analysis process.Identifying Turnover Stimulators
Identifying turnover stimulators is a simple matter of comparing your exit interview results to your employee survey results. Use the average ratings for all of the employees who have completed the exit interview thus far and the average rating of all the employees who have completed the satisfaction survey. Go through each question one-by-one and look for areas where the average rating on the exits is significantly less than the average ratings on the surveys. Tag these questions as Turnover Stimulators.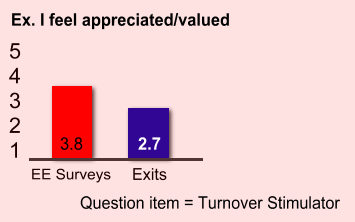 |
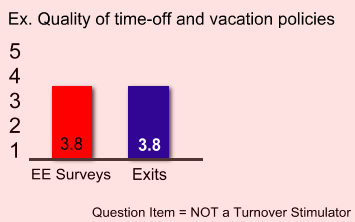
This means that employees who choose to leave feel more negatively about the particular question item than the general population of employees. Items where the average exit interview ratings are equal to the average survey ratings would not be considered turnover stimulators since employees who leave feel generally the same as people who stay. This indicates that this particulars question item has little to no affect on turnover.
 |
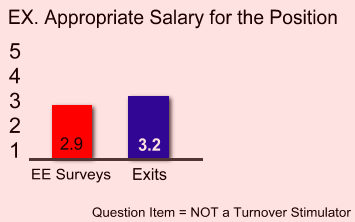
When the current employee ratings (surveys) are lower than the terminating employees (exits), this indicates that this question area is the LEAST likely item to cause turnover.
 |
Determining Threshold Values
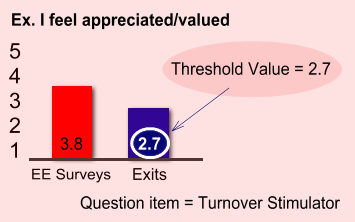
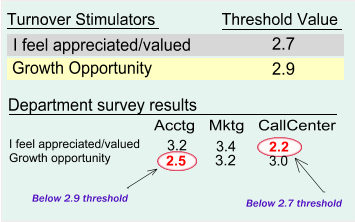
Once your Turnover Stimulators are identified, you can set threshold rating values. The threshold values provide an indication at what rating level turnover can be expected to occur. Threshold values should be recorded for each Turnover Stimulators. The threshold value equals the average exit interview rating for that question item. You only need to score thresholds values for question items where the exit rating is significantly lower than the survey ratings.The following Illustration shows the Threshold value for the Turnover Stimulator identified in the previous example.
 |
Creating Your Turnover Prediction Map
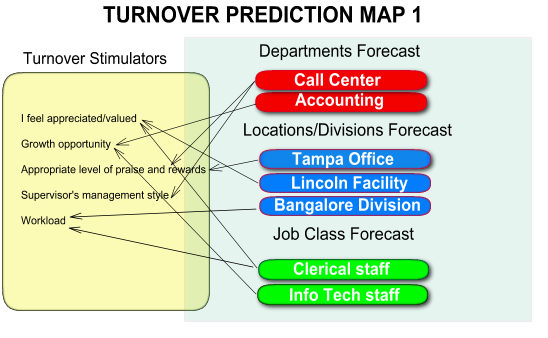
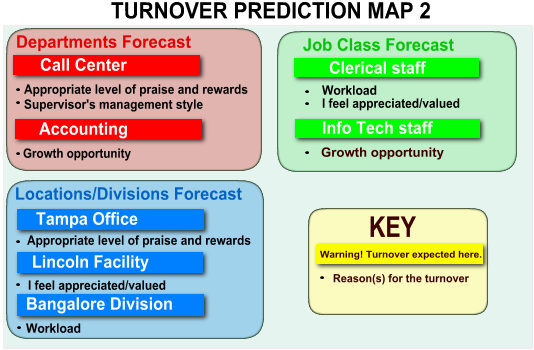
With the Turnover Stimulators and corresponding threshold values identified, you are ready to create your Turnover Prediction Map. This map will point to departments, locations, job classes or other demographic groupings that have a high probability of experiencing future turnover.To create your map, complete the following steps:
- Make a list of your Turnover Stimulators.
- Add the corresponding threshold values for each Turnover Stimulator.
- Select one of the demographics that you have included as part of your Employee Survey such as "Department".
- Display the average Employee Survey ratings (on the 1-5 scale) for each area in your selected demographic group.
- Compare the average Employee Survey Rating on each of the Turnover Stimulator questions to the corresponding Threshold value for that stimulator.
- Tag those questions where the average survey rating is equal to or lower than the corresponding Threshold value.
- Repeat above steps for each demographic breakdown.
- Draw your map with all of your tagged items.
 |
 |
Nobscot Corporation's EE*Trends
Nobscot Corporation is a pioneer in the field of Employee Turnover Prediction. Nobscot was the first to incorporate an automated prediction modeling engine into their EE*Trends employee satisfaction measurement and prediction system. EE*Trends combines a powerful employee satisfaction survey system with Nobscot's award-winning WebExitTM, exit interview management system. Learn more about EE*Trends at: EE*Trends Employee Satisfaction Measurement and Prediction System.For more information on how you can begin to create customized turnover predictions for your organization, contact a Nobscot representative at (888) 662-7444, email: info@nobscot.com or fill out this quick form to request a demo:Turnover Prediction System Demo.
New Article