
|
| |||||||||||
|
|
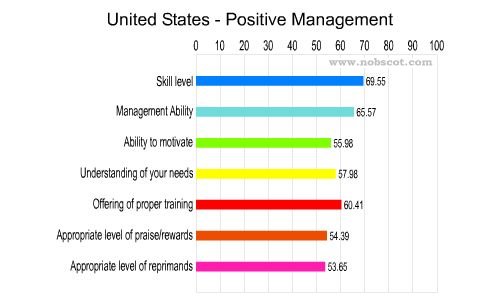
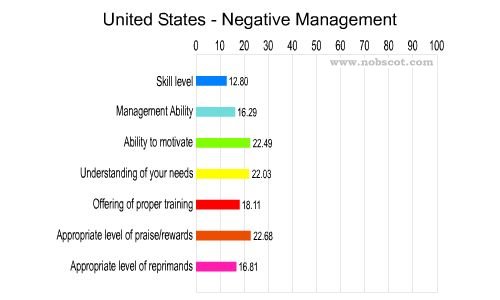
| United States | ||||||||||
|---|---|---|---|---|---|---|---|---|---|---|
| Average Score | Positive Rating | Negative Rating | ||||||||
| 1. | Skill level | |||||||||
| 3.86 | 69.55% | 12.80% | ||||||||
| 2. | Management Ability | |||||||||
| 3.77 | 65.57% | 16.30% | ||||||||
| 3. | Ability to motivate | |||||||||
| 3.53 | 55.98% | 22.49% | ||||||||
| 4. | Understanding of your needs | |||||||||
| 3.59 | 57.98% | 22.03% | ||||||||
| 5. | Offering of proper training | |||||||||
| 3.64 | 60.41% | 18.11% | ||||||||
| 6. | Appropriate level of praise/rewards | |||||||||
| 3.50 | 54.39% | 22.68% | ||||||||
| 7. | Appropriate level of reprimands | |||||||||
| 3.57 | 53.65% | 16.81% | ||||||||
|
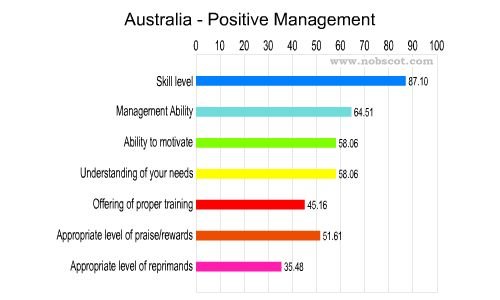
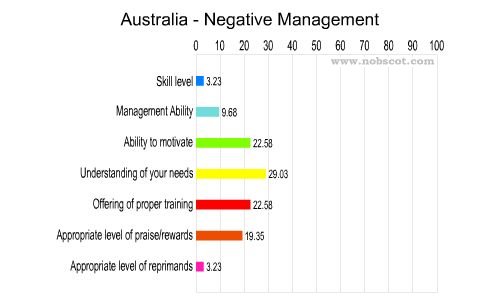
| Australia | ||||||||||
|---|---|---|---|---|---|---|---|---|---|---|
| Average Score | Positive Rating | Negative Rating | ||||||||
| 1. | Skill level | |||||||||
| 4.23 | 87.10% | 3.23% | ||||||||
| 2. | Management Ability | |||||||||
| 3.84 | 64.52% | 9.68% | ||||||||
| 3. | Ability to motivate | |||||||||
| 3.65 | 58.06% | 22.58% | ||||||||
| 4. | Understanding of your needs | |||||||||
| 3.61 | 58.06% | 29.03% | ||||||||
| 5. | Offering of proper training | |||||||||
| 3.29 | 45.16% | 22.58% | ||||||||
| 6. | Appropriate level of praise/rewards | |||||||||
| 3.45 | 51.61% | 19.35% | ||||||||
| 7. | Appropriate level of reprimands | |||||||||
| 3.42 | 35.48% | 3.23% | ||||||||
|
| Belgium | ||||||||||
|---|---|---|---|---|---|---|---|---|---|---|
| Average Score | Positive Rating | Negative Rating | ||||||||
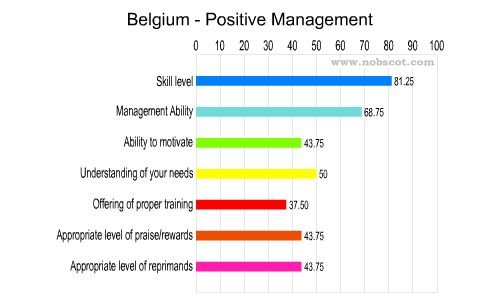
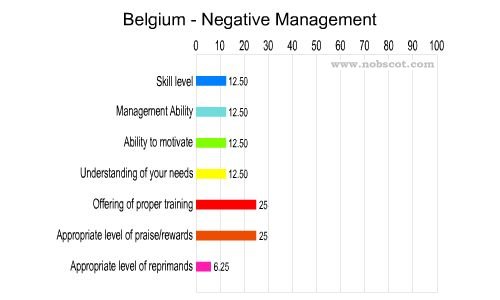
| 1. | Skill level | |||||||||
| 3.81 | 81.25% | 12.50% | ||||||||
| 2. | Management Ability | |||||||||
| 3.56 | 68.75% | 12.50% | ||||||||
| 3. | Ability to motivate | |||||||||
| 3.31 | 43.75% | 12.50% | ||||||||
| 4. | Understanding of your needs | |||||||||
| 3.44 | 50.00% | 12.50% | ||||||||
| 5. | Offering of proper training | |||||||||
| 3.06 | 37.50% | 25.00% | ||||||||
| 6. | Appropriate level of praise/rewards | |||||||||
| 3.13 | 43.75% | 25.00% | ||||||||
| 7. | Appropriate level of reprimands | |||||||||
| 3.31 | 43.75% | 6.25% | ||||||||
|
| Canada | ||||||||||
|---|---|---|---|---|---|---|---|---|---|---|
| Average Score | Positive Rating | Negative Rating | ||||||||
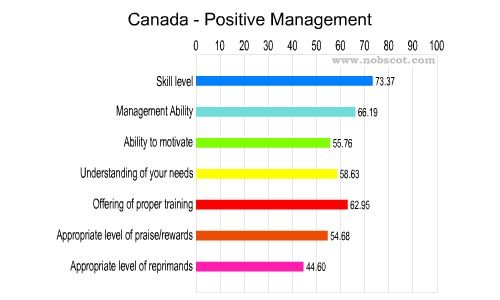
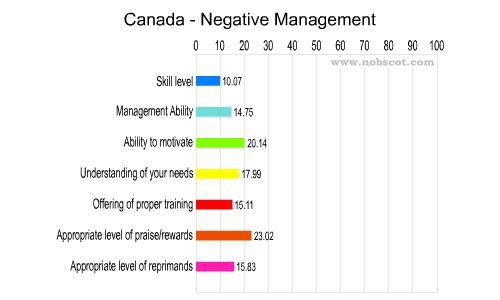
| 1. | Skill level | |||||||||
| 3.91 | 73.38% | 10.07% | ||||||||
| 2. | Management Ability | |||||||||
| 3.71 | 66.19% | 14.75% | ||||||||
| 3. | Ability to motivate | |||||||||
| 3.51 | 55.76% | 20.14% | ||||||||
| 4. | Understanding of your needs | |||||||||
| 3.61 | 58.63% | 17.99% | ||||||||
| 5. | Offering of proper training | |||||||||
| 3.71 | 62.95% | 15.11% | ||||||||
| 6. | Appropriate level of praise/rewards | |||||||||
| 3.49 | 54.68% | 23.02% | ||||||||
| 7. | Appropriate level of reprimands | |||||||||
| 3.41 | 44.60% | 15.83% | ||||||||
|
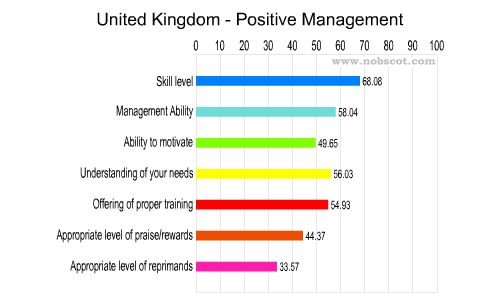
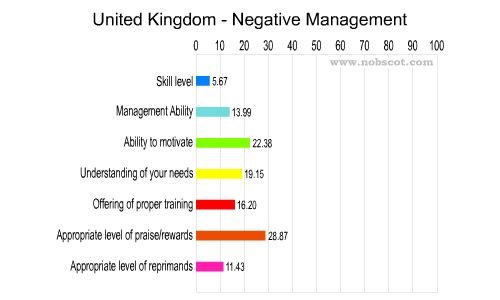
| United Kingdom | ||||||||||
|---|---|---|---|---|---|---|---|---|---|---|
| Average Score | Positive Rating | Negative Rating | ||||||||
| 1. | Skill level | |||||||||
| 3.83 | 68.09% | 5.67% | ||||||||
| 2. | Management Ability | |||||||||
| 3.61 | 58.04% | 13.99% | ||||||||
| 3. | Ability to motivate | |||||||||
| 3.40 | 49.65% | 22.38% | ||||||||
| 4. | Understanding of your needs | |||||||||
| 3.55 | 56.03% | 19.15% | ||||||||
| 5. | Offering of proper training | |||||||||
| 3.58 | 54.93% | 16.20% | ||||||||
| 6. | Appropriate level of praise/rewards | |||||||||
| 3.23 | 44.37% | 28.87% | ||||||||
| 7. | Appropriate level of reprimands | |||||||||
| 3.29 | 33.57% | 11.43% | ||||||||
|
| How Honest Is Your Feedback? RIF Manager FirstDays for New Hires | |||||
| Who we are | Customer Support | Products | Press | Employee Mentoring | Corporate Talent Networking |
| Customers | Testimonials | Home | Site Map | Employee Retention News | Rebound Employees |
| Exit Interview | Employee Satisfaction Survey | What is an Exit Interview? | Employee Turnover Rates |
© Copyright 2000-2025 Nobscot Corporation. All Rights Reserved.
Privacy Policy -
Terms of Use
Change my password.